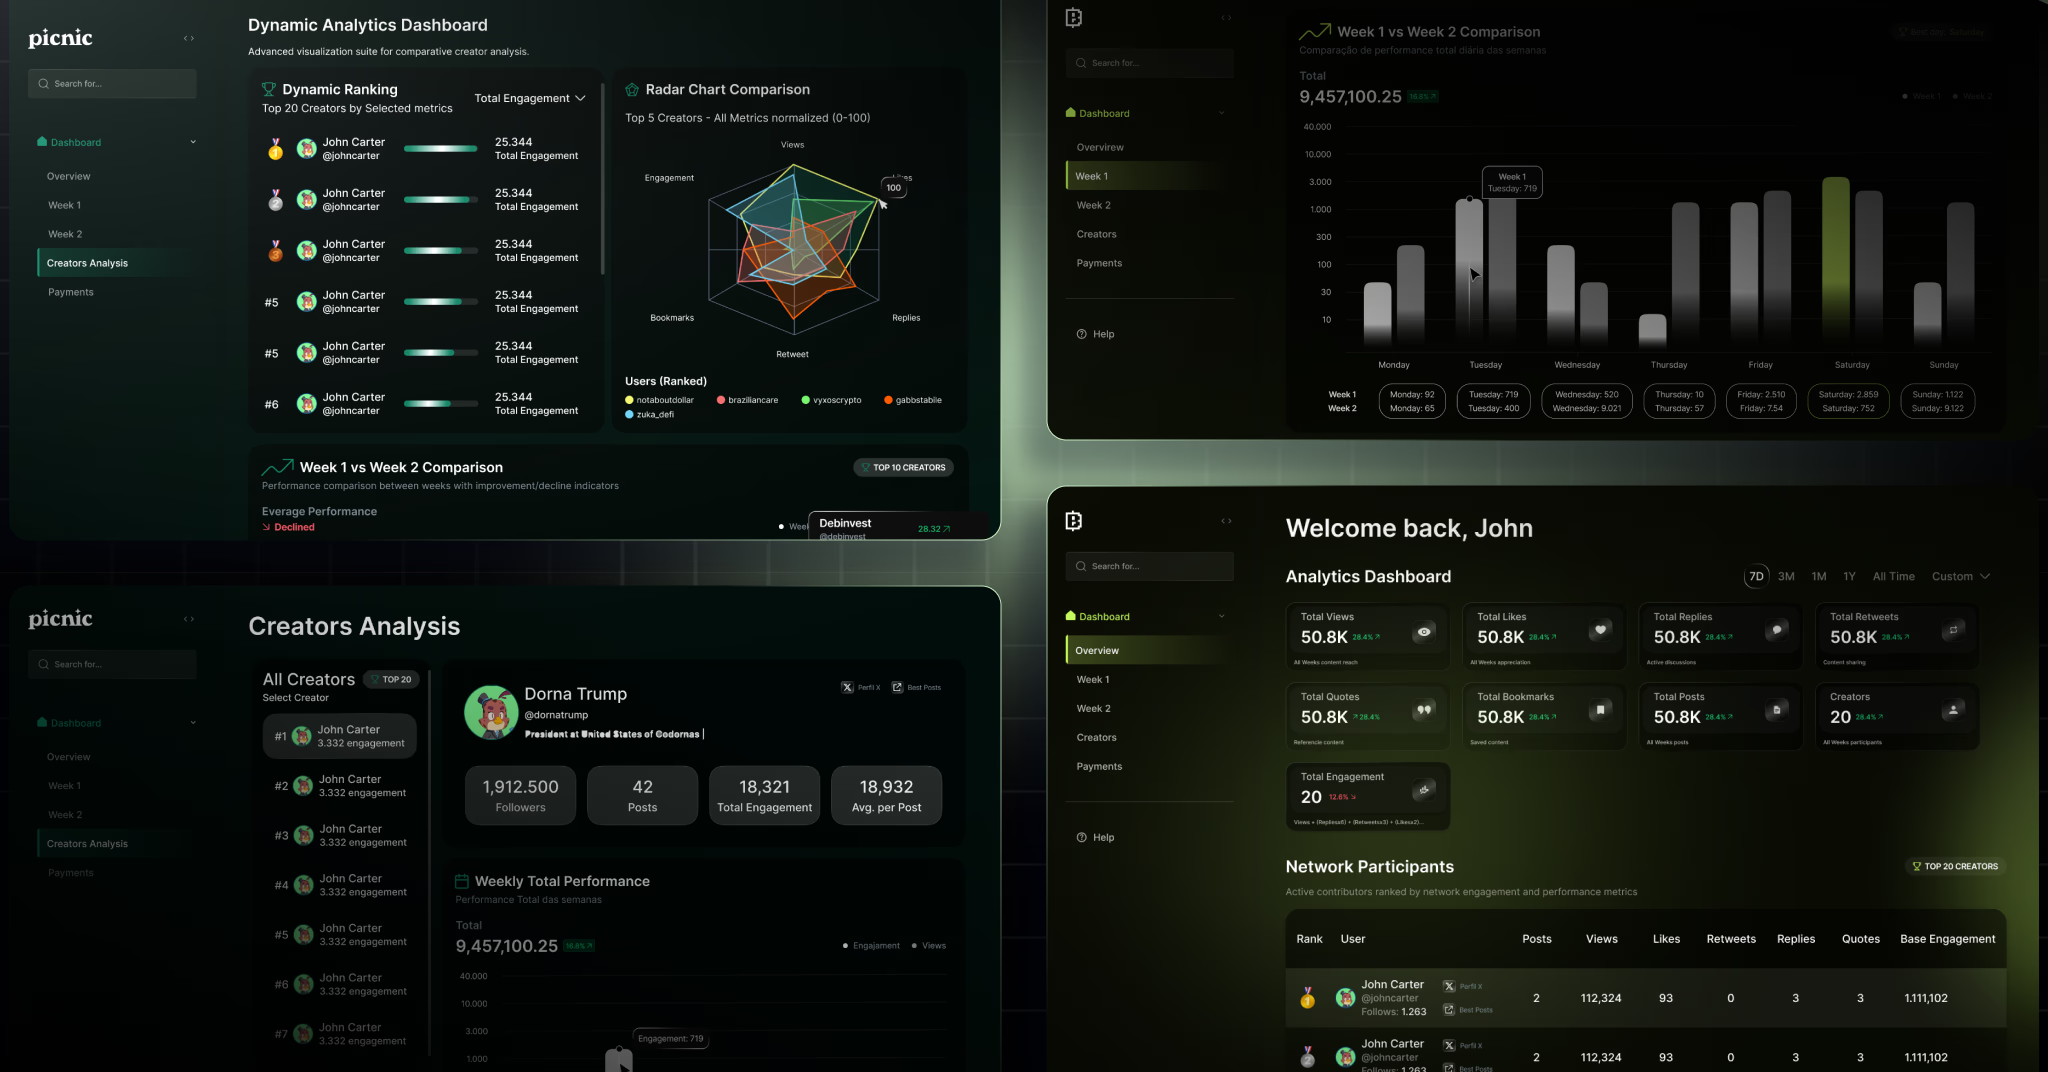
ParaDevs Analytics Dashboard
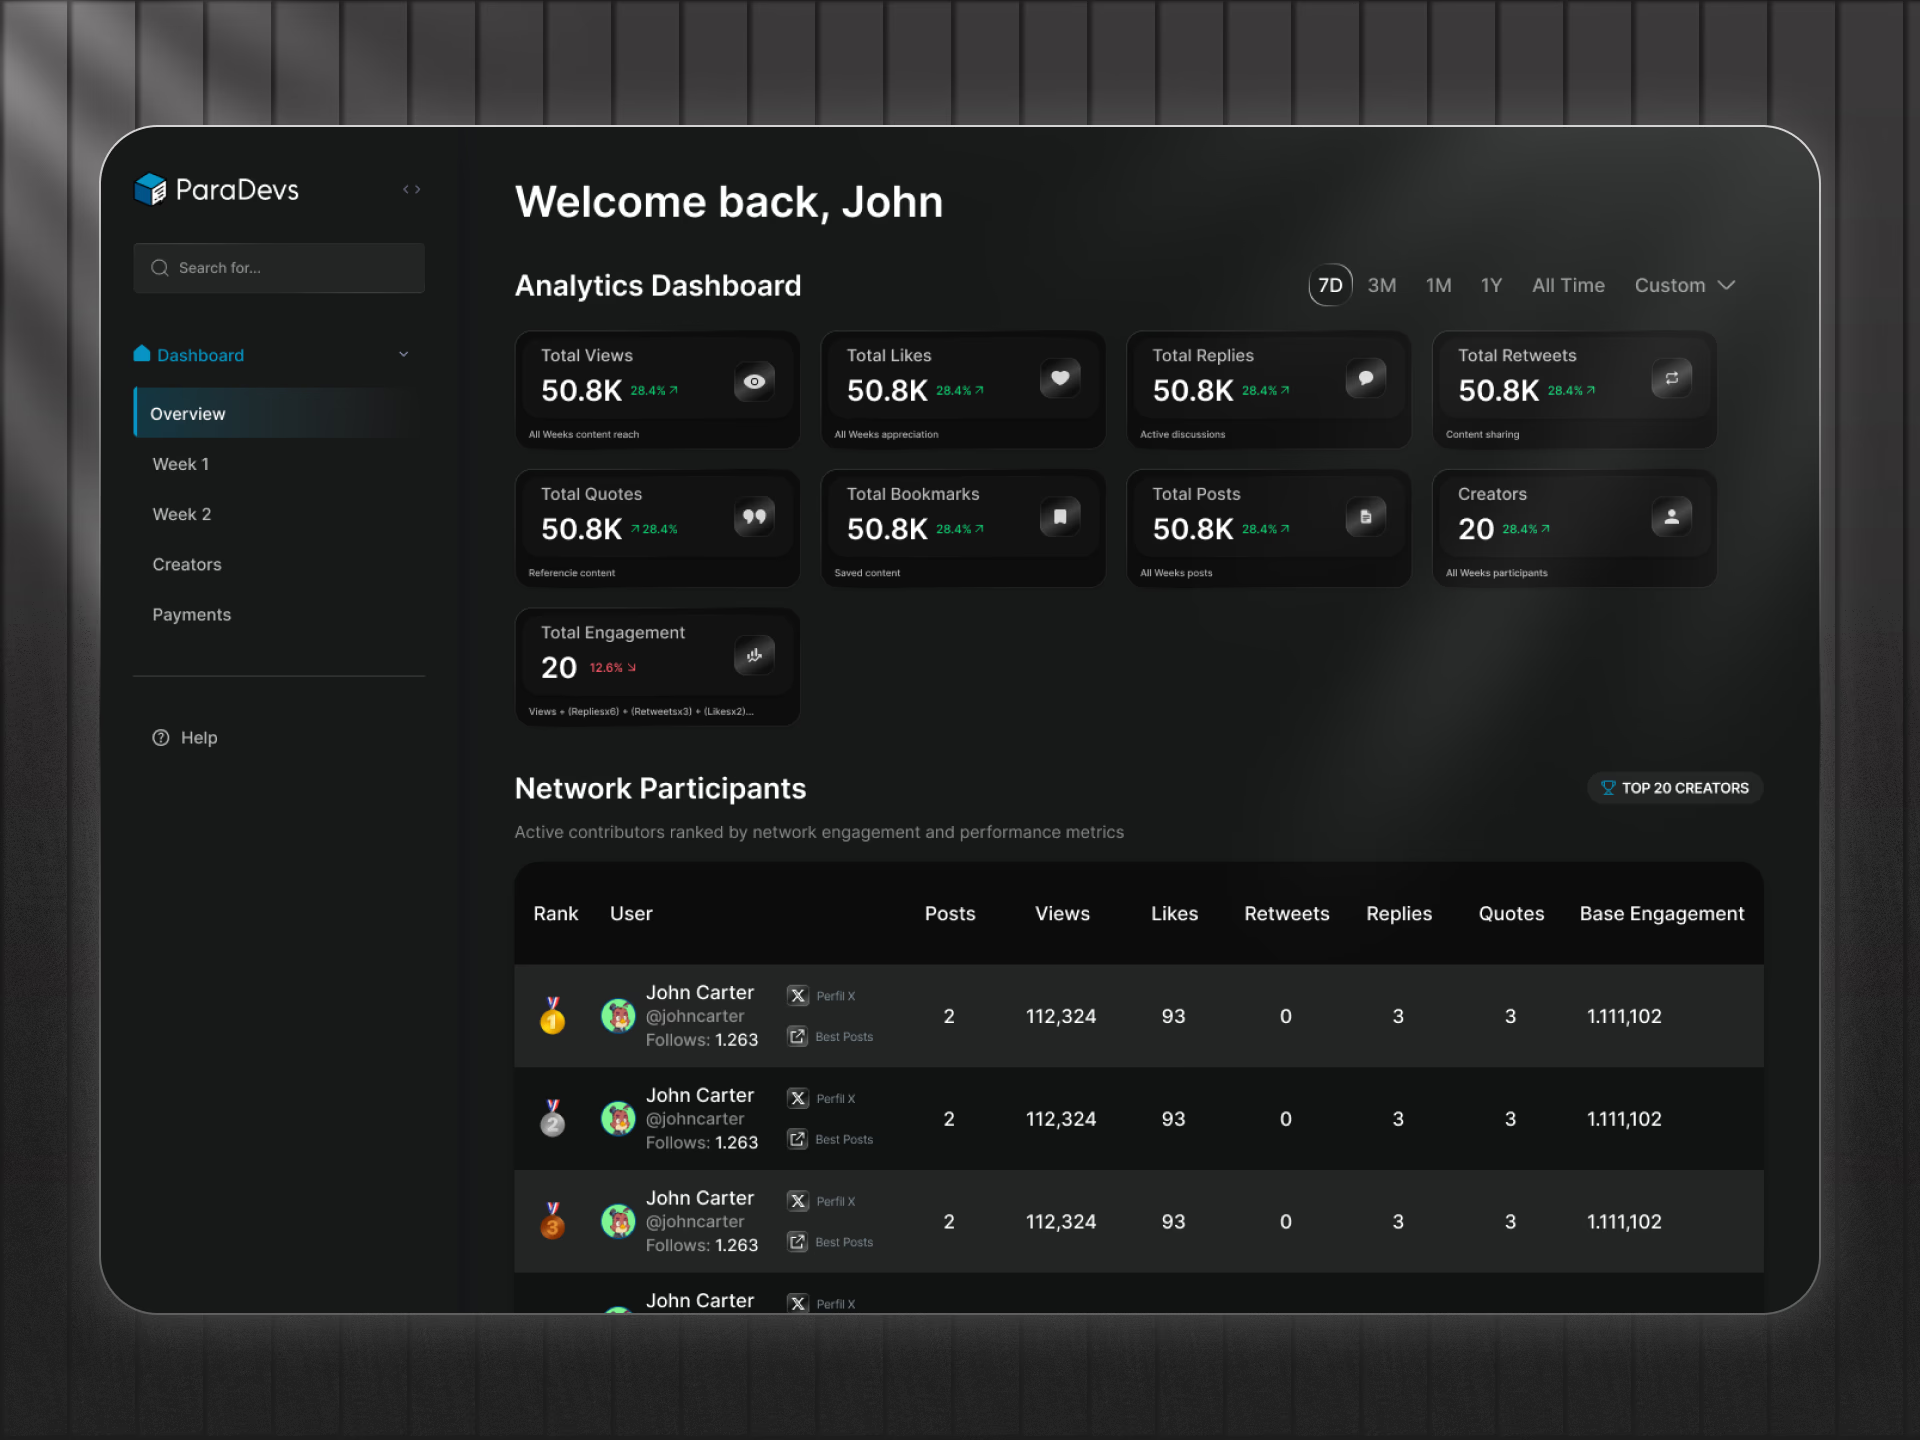
A modular, data-driven analytics dashboard for Web3 marketing campaigns, allowing project partners and creators to track engagement, performance, and rewards across multiple campaigns and timeframes.
The Goal
Create a scalable, theme-adaptable analytics system that can integrate with different protocols’ data pipelines.
The Challenge
Transform complex, scattered campaign data into visual insights that developers and marketing leads could easily understand.
The Solution
A flexible dashboard ecosystem that adapts to campaign structures, supports multiple color themes, and displays comparative analytics between creators, weeks, and engagement metrics.
Project outcomes and supporting evidence are being reviewed before publication.
Recent Designs

Let's Build Something Meaningful
Open to Opportunities
Exploring Product Designer and UX/UI opportunities where I can contribute to meaningful digital products.
Let's Talk Product & Design
Always happy to exchange ideas about UX, product strategy, design systems and digital experiences.